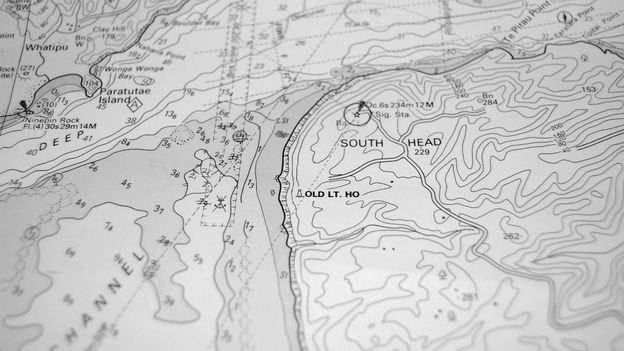
Improved charts could boost trade, transit and tourism on the outer islands. They could help communities plan for tsunamis, storm surges and rising shorelines. Many islands lack basic tide gauges, and so visiting ships time their arrival for high tide. In his meetings with government ministers, Uriam tries to stress the economic benefits of improving nautical charts in Kiribati. However, there’s a roadblock when it comes to sharing maps with the DCDB archive back in Boulder. Around a third of the IHO’s 98 member states allow crowdsourcing inside territorial waters. However, the Pacific island nations of Kiribati, the Independent State of Samoa and the Cook Islands, which all recently received data loggers from Seabed 2030, are not among them. Until the governments give their blessing, the new crowdsourced maps will remain under wraps. Despite Seabed 2030’s publicly stated scientific goal, the military or commercial value of nautical charts will always be a barrier to achieving complete coverage of the world map. “Sea charts, by their very nature, were destined to be removed from the academic realm and from general circulation,” wrote the map historian Lloyd Brown in his book The Story of Maps. “They were much more than an aid to navigation; they were in effect, the key to empire, the way to wealth.” In a world where only a quarter of the seafloor is charted, there’s still an advantage in knowing more than your rivals. Niwa’s Mackay experienced this himself on a scientific-mapping expedition. He received a call from a military he chooses not to name and “they said ‘you need to destroy that data because there was military value in what you’re mapping, because it’s a place where submarines like to hide’,” he recalls. “Obviously, we ignore them because we’re [mapping] for science, we don’t care. But the military, they find lots of value in bathymetry that, as a scientist, we don’t even think about.”
2 September, Monday, 2024


